Your business,
AI-enabled.
PBI Align gives mid-market businesses a live, AI-interpreted view of how their strategy is performing - and what to act on before it slips.
A 45-minute conversation. No commitment required.
AI does not fail because the technology is weak.
It fails because the business is not ready.
Most mid-market businesses are sitting on the same six problems. Each one makes AI harder to deploy, harder to trust, and harder to act on.
Data is scattered
Performance data lives in spreadsheets, inboxes, and disconnected systems. AI cannot operate on data that is fragmented, inconsistent, or manually maintained.
Underperformance is caught too late
Issues surface after the damage is done. Without consistent, timely data, there is no reliable trend history for AI to learn from.
Departments pull in different directions
Teams work hard but not always toward what the business needs most. AI needs clear objectives and structured commitments to interpret performance correctly.
Leaders collect data, not act on it
Time goes to gathering information rather than using it. Without structured, decision-ready data, the business never builds the discipline AI requires.
Improvement happens in isolation
CI activity has no visible link to strategic goals. Without defined workflows and decision governance, AI has no framework to guide or enhance.
Reporting consumes delivery time
Manual reporting creates inconsistent structures. AI cannot automate insight or action when every report is built differently.
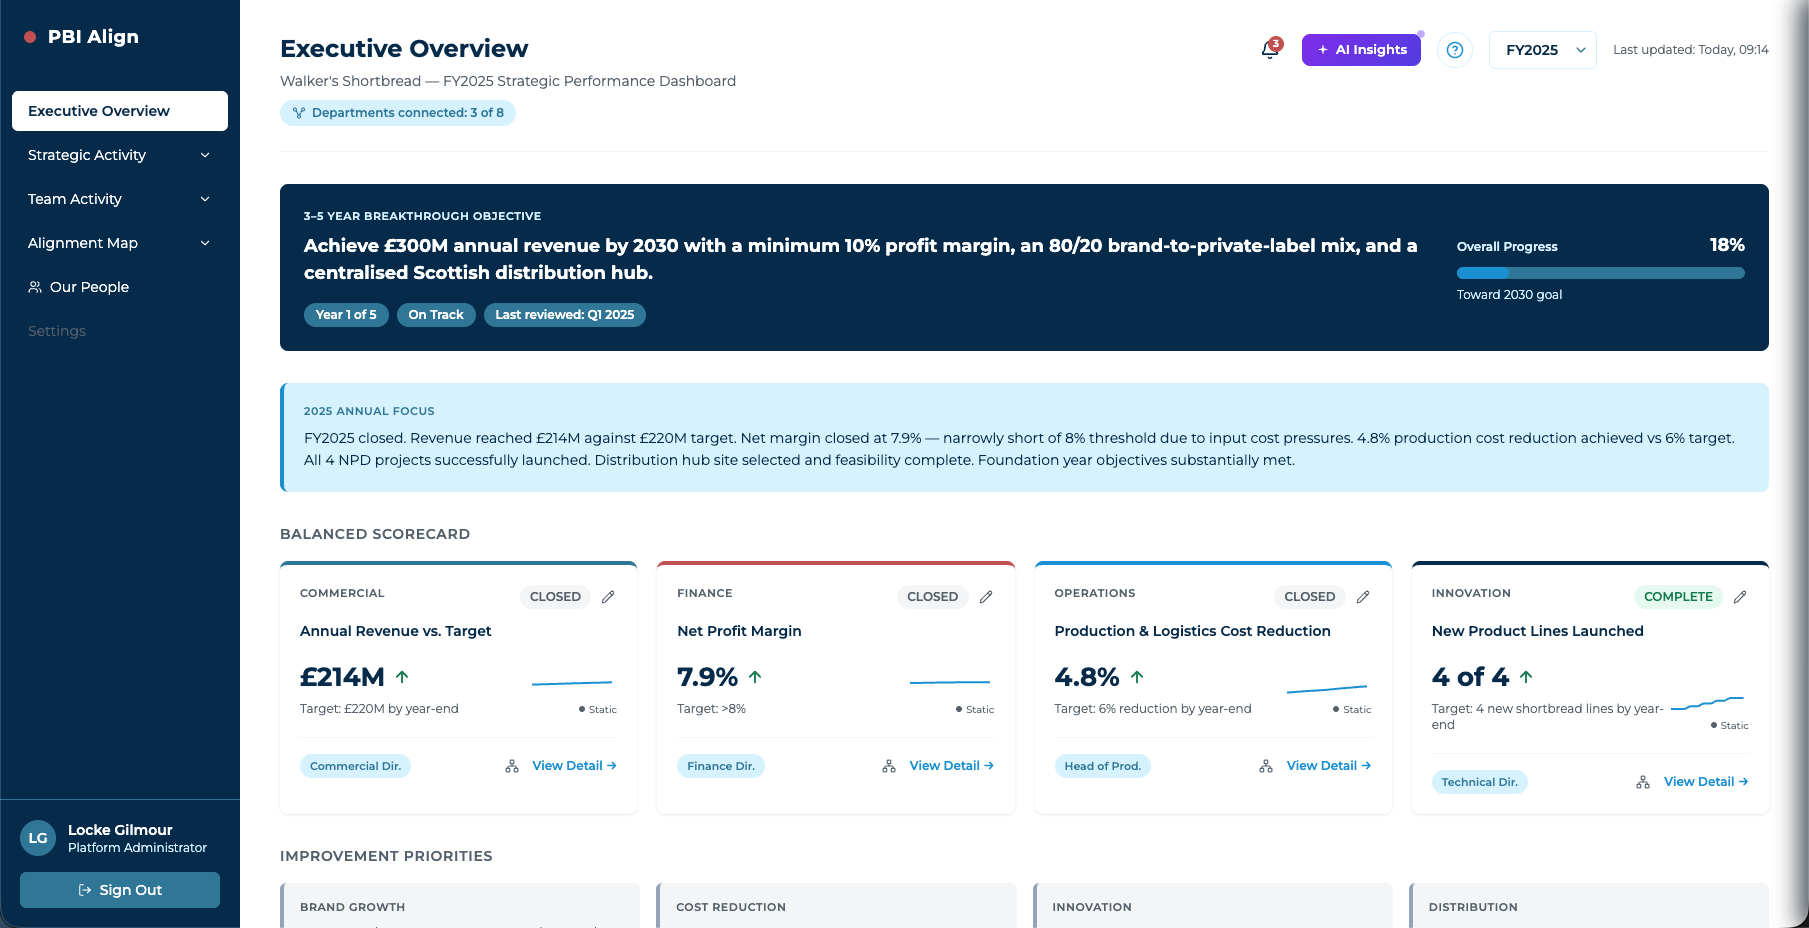
One platform. Three levels. AI that interprets, not just displays.
PBI Align connects your existing data sources to a structured three-level model and layers AI on top that interprets what is happening, flags where performance is drifting, and tells you what to do about it before the gap widens.
Board visibility
Business-wide KPIs tied directly to strategic objectives. The board sees at any moment whether the business is on track, without waiting for a report.
Departmental alignment
Each department formally commits its activity to a named board objective. Live data pulled from the sources teams already use.
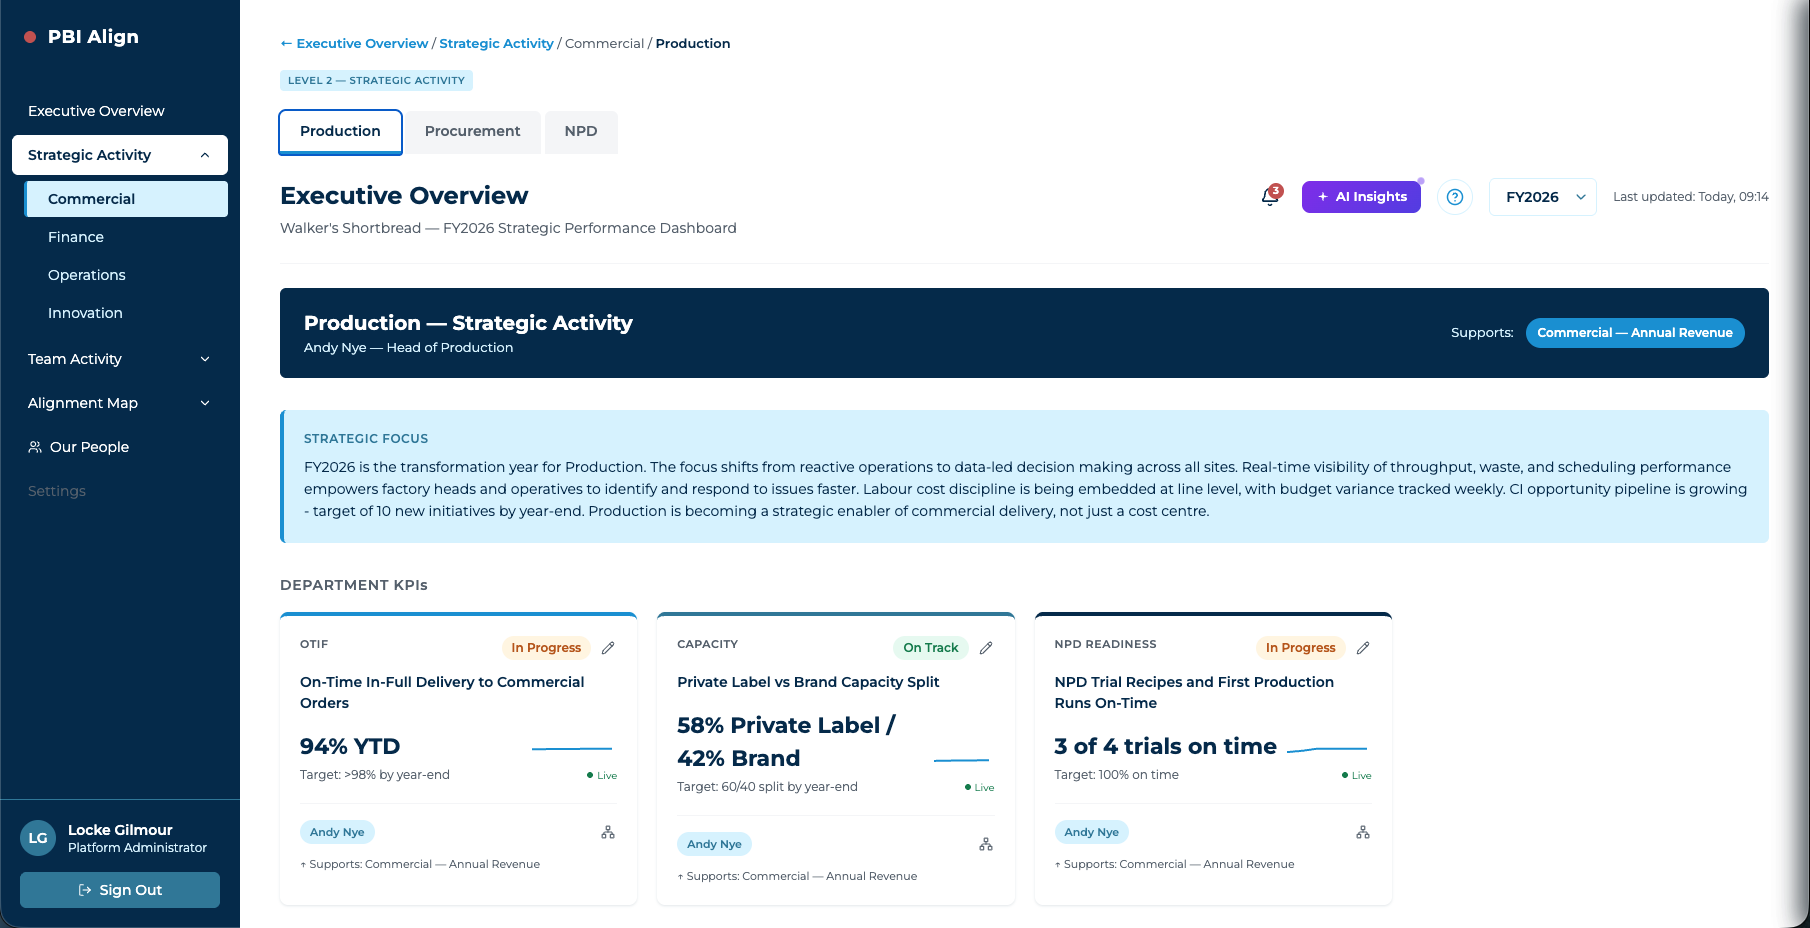
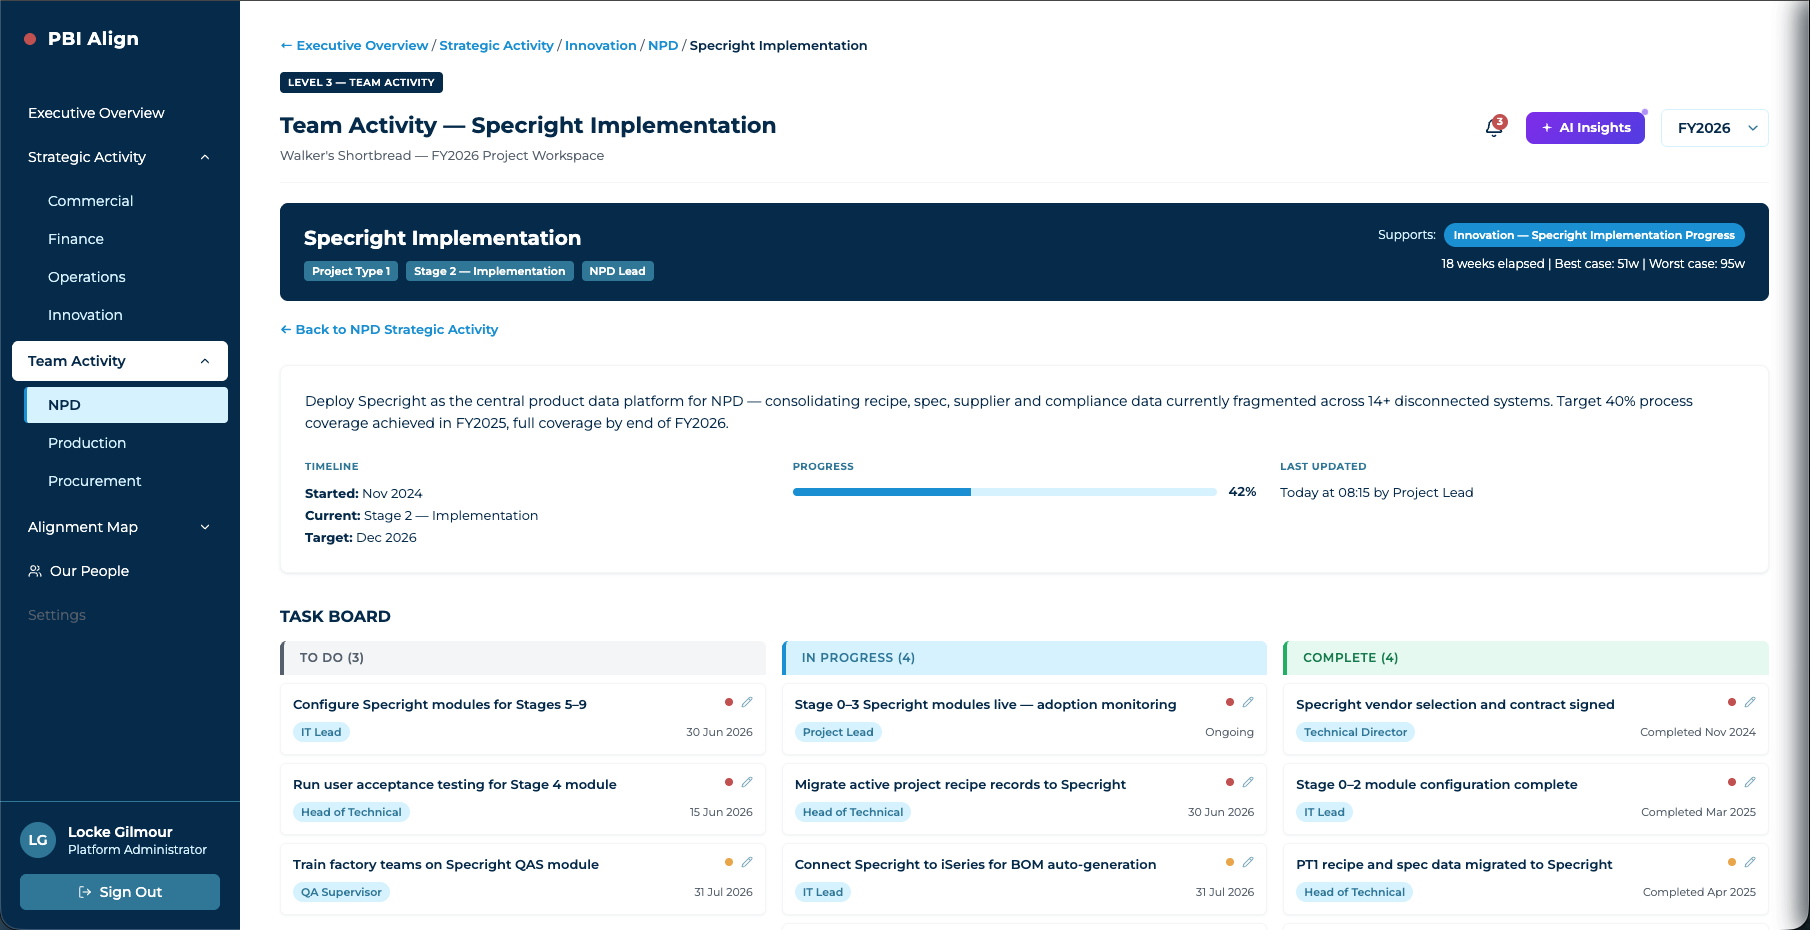
Daily connection to strategy
Task boards and weekly metrics. Teams see exactly which objectives they are contributing to and how.
Four AI capabilities. Each one does something a dashboard alone cannot.
The AI layer does not just display your data - it interprets it, contextualises it, and tells your team what to do next.
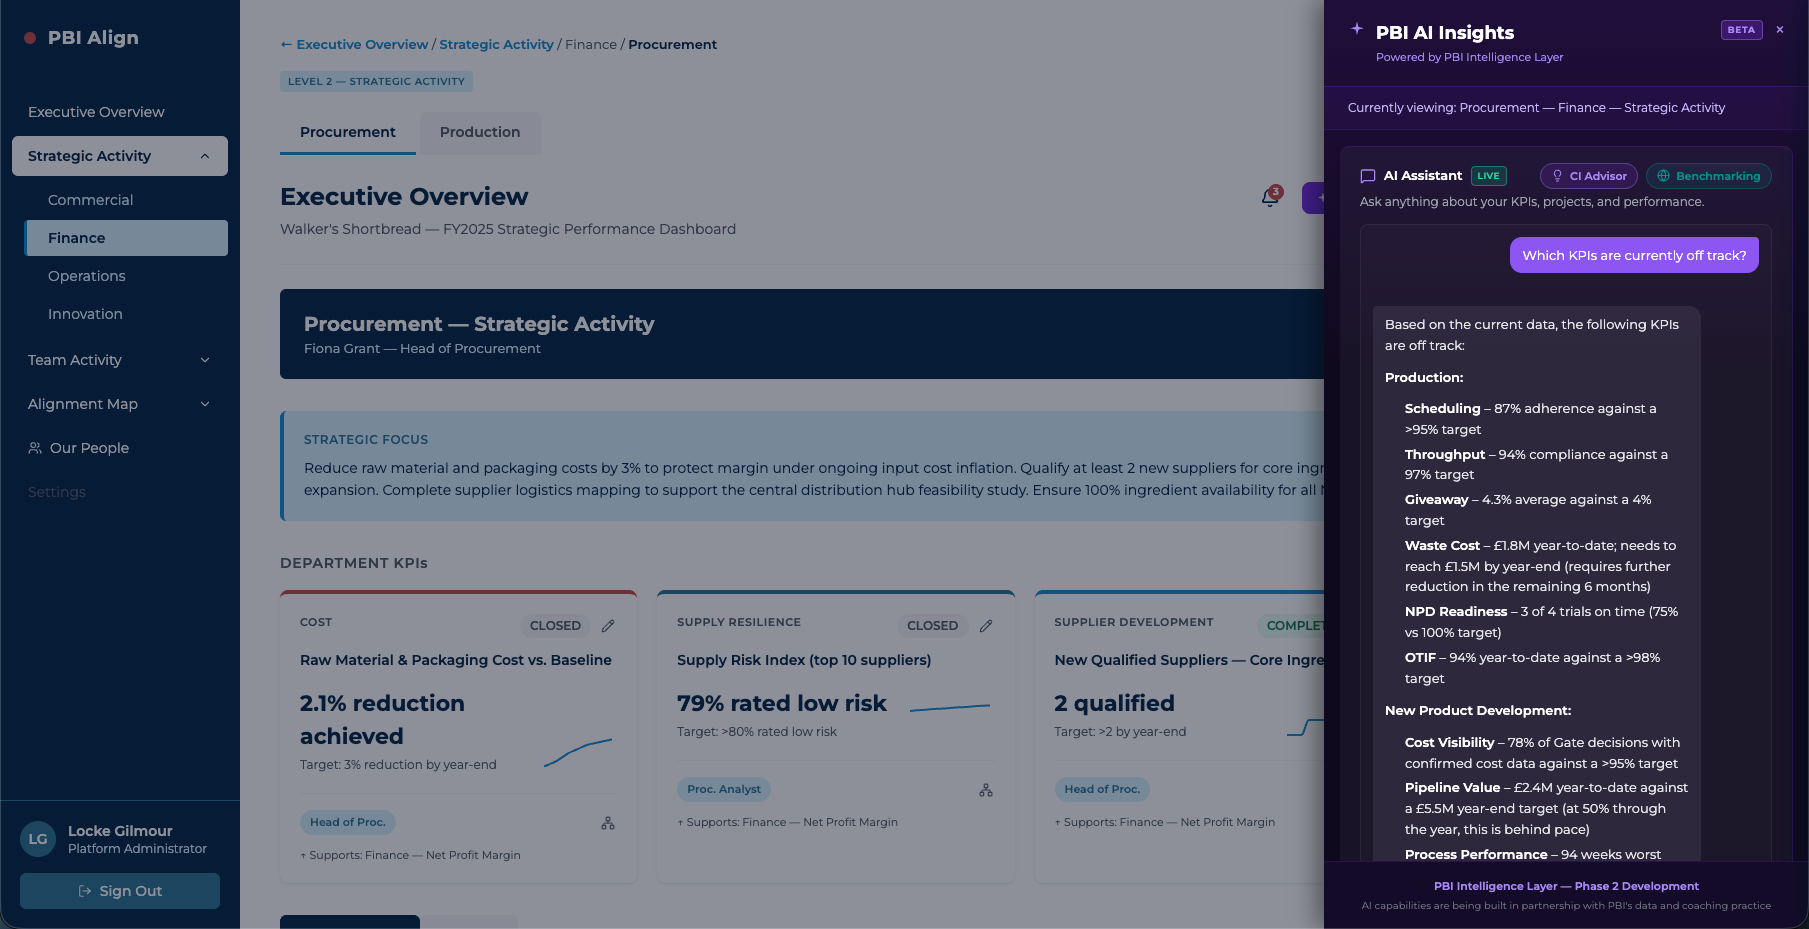
AI Chat Assistant
The numbers personLoaded with your live KPI data when you open it. Ask it where performance stands, what a trend means, or what a mid-year position looks like against target. It answers in plain English, not a formula.
Connectivity Intelligence
The context layerOn every KPI card. Shows which strategic objective the metric supports, where the data comes from, and who owns it - with a plain English summary of what the number means.
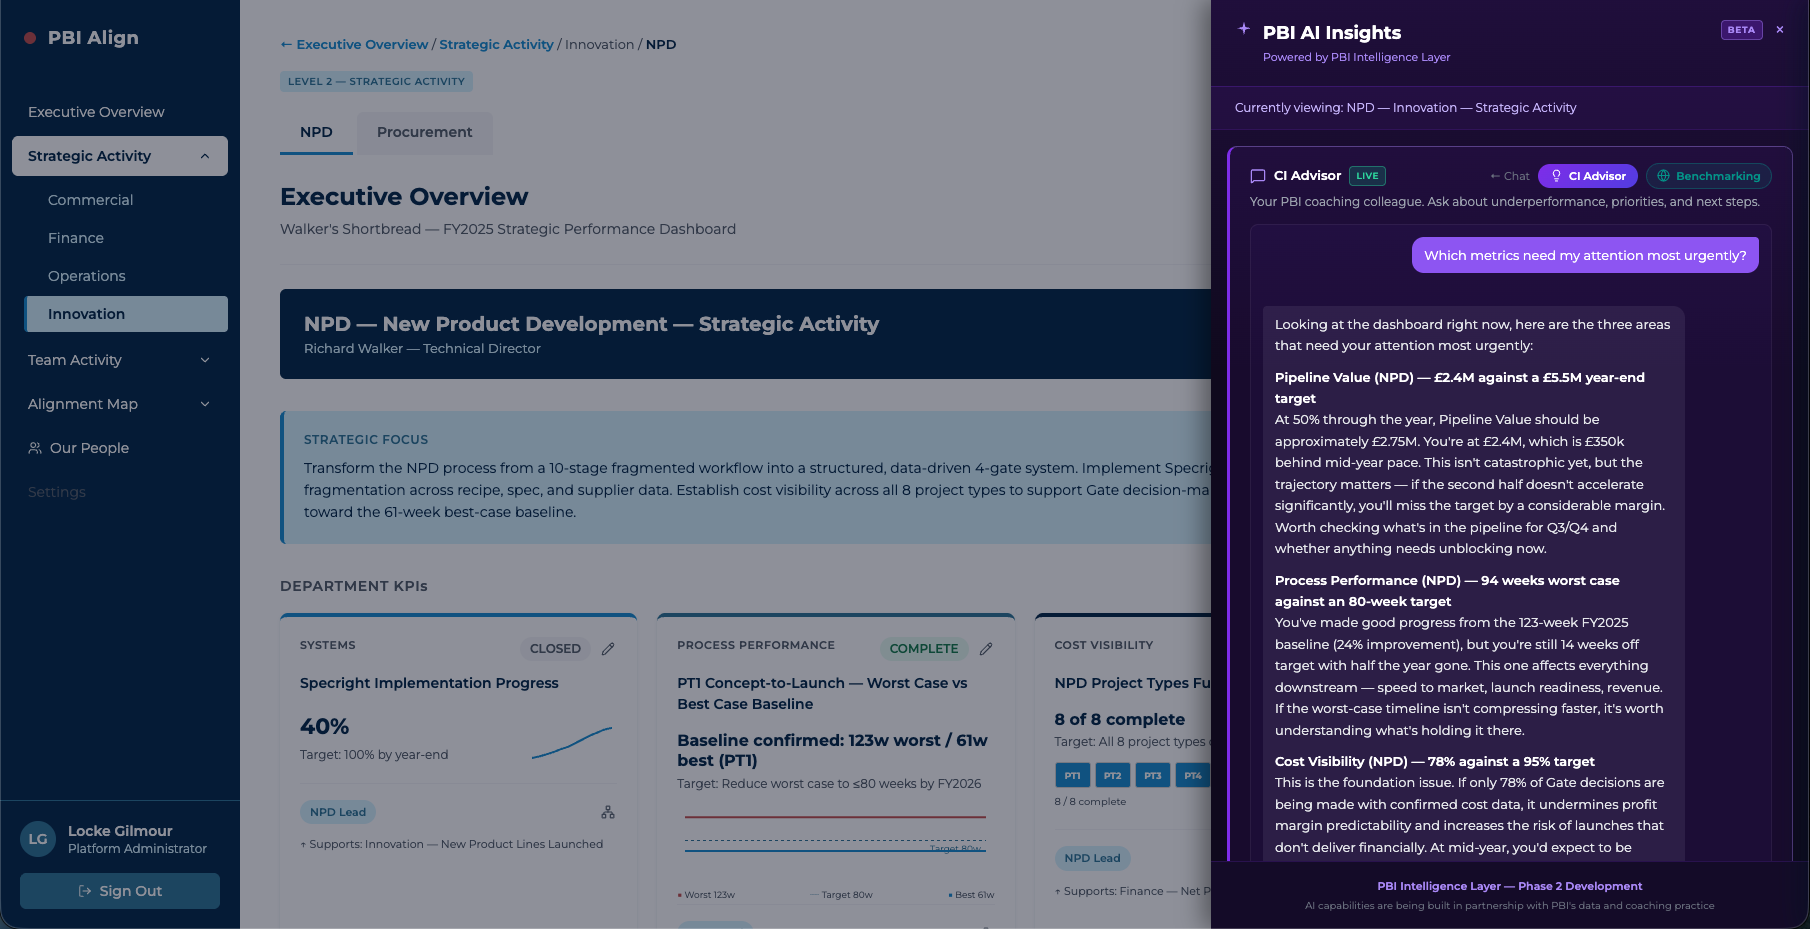
CI Advisor
The improvement coachWhen a metric underperforms, CI Advisor does not just flag it. It identifies the likely cause, suggests the right response, and tells you who needs to be involved. Built around PBI's improvement methodology.
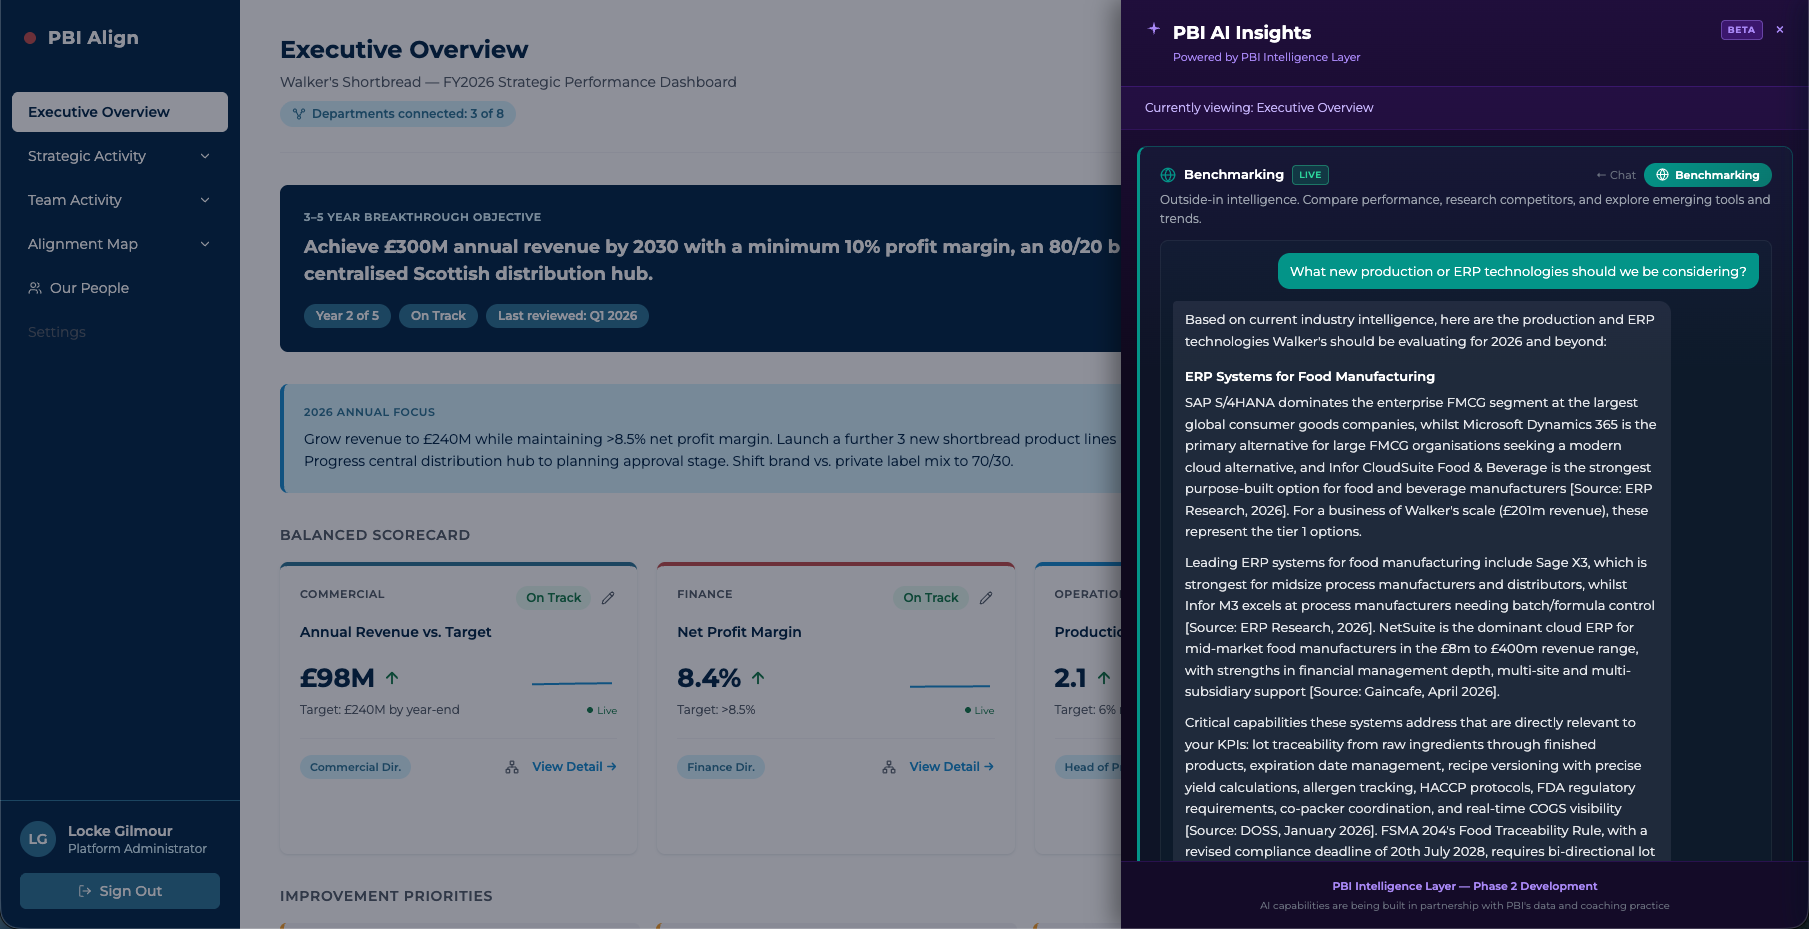
Industry Benchmarking
The market intelligenceLive web search, built into the dashboard. Competitor activity, sector benchmarks, emerging trends - external context sitting next to your internal metrics, so a leadership team knows not just what their numbers are, but whether they are good.
These are not hypothetical problems.
PBI has worked inside organisations across Oil and Gas, Manufacturing, Renewables, FMCG, and Engineering for over two decades. The six problems below are ones we have seen repeatedly, in real businesses, with real financial consequences. PBI Align is built around each of them.
Data exists. Nobody trusts it.
An offshore operator discovered stock accuracy had been sitting at 62% for years - not 97% as the system reported. Every decision built on those numbers was built on an assumption nobody had tested.
Strategy and data both fragment.
A renewables developer had eight country teams all reporting up to a global position, each using their own version of the process. The consolidated figure looked right. The structure holding it together was not.
Nobody owns the metric.
A global services business had millions sitting in disputed invoices. The risk was not hidden. It had simply never been anyone's job to surface it. Once ownership was made explicit, resolution time dropped by a fifth.
The business finds out too late.
A food manufacturer was losing close to £6 million a year in product giveaway. The weekly Excel report arrived after the week was already over. It confirmed the loss. It could not prevent the next one.
Visibility exists. No structure to act on it.
A North Sea operator had already paid for the answer to a problem engineers were still solving the hard way. A digital twin sat largely unused while offshore trips continued as routine. The capability was there. The habit was not.
A number alone does not say if it is good.
A food manufacturer was tracking OTIF at 81% against its own internal target. Against the industry standard of 98%, it was a serious risk to customer relationships that had never been framed that way.
The features in action
CI Advisor -- structured response to underperformance
AI Chat Assistant -- plain English performance answers
Industry Benchmarking -- live sector context
These results come from PBI's coaching and facilitation work. They demonstrate the methodology and the people behind PBI Align, not outcomes attributed to the platform itself.
PBI configures and deploys PBI Align.
This is not a self-serve tool.
We handle the setup so your team does not have to. From readiness assessment to go-live, every step is managed by PBI.
Readiness Assessment
Understand your current KPI structure, data sources, and alignment gaps. This determines your timeline and setup scope.
Data Collection
Map your existing data sources and connect them to the platform. Where KPI gaps exist, PBI's coaching expertise closes them here, included in the setup fee.
Build and Connect
Configure the platform to your objective structure. Set up all three levels. Connect live data feeds. Your subscription starts here.
Go Live
Platform live. PBI provides handover, review cadence design, and coaching support as part of the ongoing relationship.
Data-ready businesses: live in as little as 4 weeks. Where KPI gaps need closing first: typically 6 to 10 weeks. The setup fee reflects the scope of readiness work required, not a flat rate.
Straightforward pricing.
No hidden complexity.
Annual subscription. Minimum 10 users across all tiers.
One-time setup fee from £3,000, scaled to your onboarding scope.
Not sure which tier is right? We will recommend the right fit during your demo.
Book a 45-minute conversation.
We will walk you through the platform, answer your questions, and tell you honestly what getting started would look like for your business.